Does Population Growth Need to Be Stopped? The Answer Is More Complicated Than You Think
Arguments about a population crisis are all around us and fail to agree on even the most basic facts. Many people around the world blame the problems we face today on the fact that there are “too many people.” Policymakers around the world have tested ways to limit population growth. China’s One-Child Policy implemented legal limitations to the number of children women can have, and India even had a policy of sterilising men whose wives had children. Others accuse those who work to reduce child mortality of aggravating problems such as Climate Change. Conspiracies abound about secret plans to reduce the world population.
Despite this, many in the 1st Wave countries today are worried about quite a different problem – that of collapsing populations. Japan is well known for villages and towns inhabited by only the very old – or no one at all. Countries such as Russia have incentives to increase childbirth. Homes in Southern Italy’s fast emptying towns are sold for a euro!
So do we have a problem with overpopulation? In the following long-read, we will examine these apparent contradictions and explain how demographic booms occur. We will also show how the opportunities to limit population growth are long behind us, and we must look to other means to ease the pressures on our planet and societies.
Where are we today?
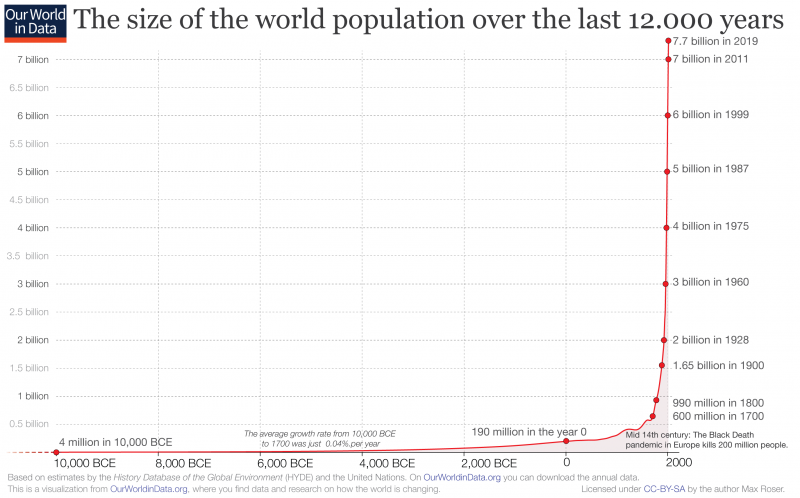
Any discussion about population growth tends to start with this hockey stick growth chart. From this graph, we can see that after 10,000 years of a very slowly growing population, the 18th century saw the beginning of a rapid demographic boom. The reason this graph starts 12,000 years ago is that around that time, we experienced another demographic boom, as humanity moved from a hunter-gatherer to an agrarian society. During that time, the world population increased from around 500,000 to around 4 million. Then, over the next 10,000 years, the world’s population continued to grow and sustain an ever-larger population; until about 300 years ago, the world’s population was 600 million. Yet, even this 150-fold increase still only represented a 0.04% growth rate per year.
Then, starting in 1700, the annual growth rate started to rise rapidly and saw the world’s population reach 1 billion in 1800, 1.6 billion in 1900, and 7.8 billion in 2020. In 2100, the UN’s median projections suggest we will reach 10.8 billion. Lower and upper ranges range between 9 and 15 billion. On what models are these projections based, and where is this population growth taking place?
How did we get here?
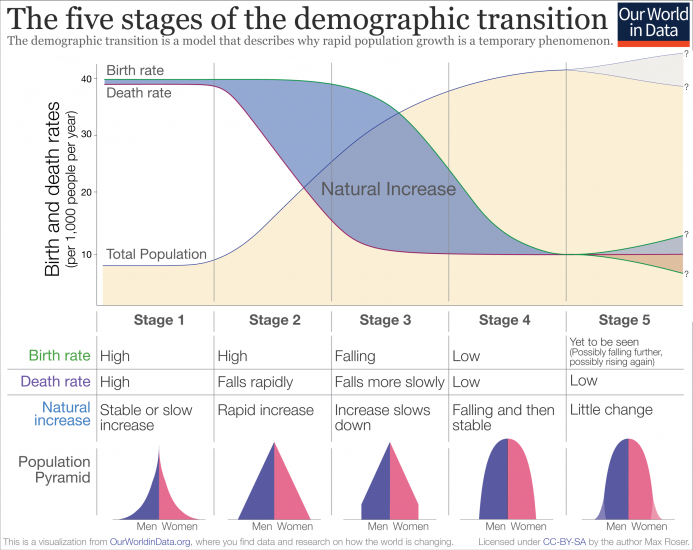
Much like the shift from a hunter-gatherer to an agrarian society triggered a population boom, so has the move from an agrarian to an urban industrial society. Two key factors influence population growth – the birth rate and the death rate. What we have seen in the 1st Wave and 2nd Wave countries, and we’re starting to see in the 3rd and 4th Wave countries, is that in the Great Transition to an Urban-Industrial society, these two factors behave as follows. Throughout most of the past 10,000 years, birth rates and death rates were high. Even children born to the elite experienced a very high child mortality rate. Demographers call this first phase of the demographic transition, the High Stationary phase.
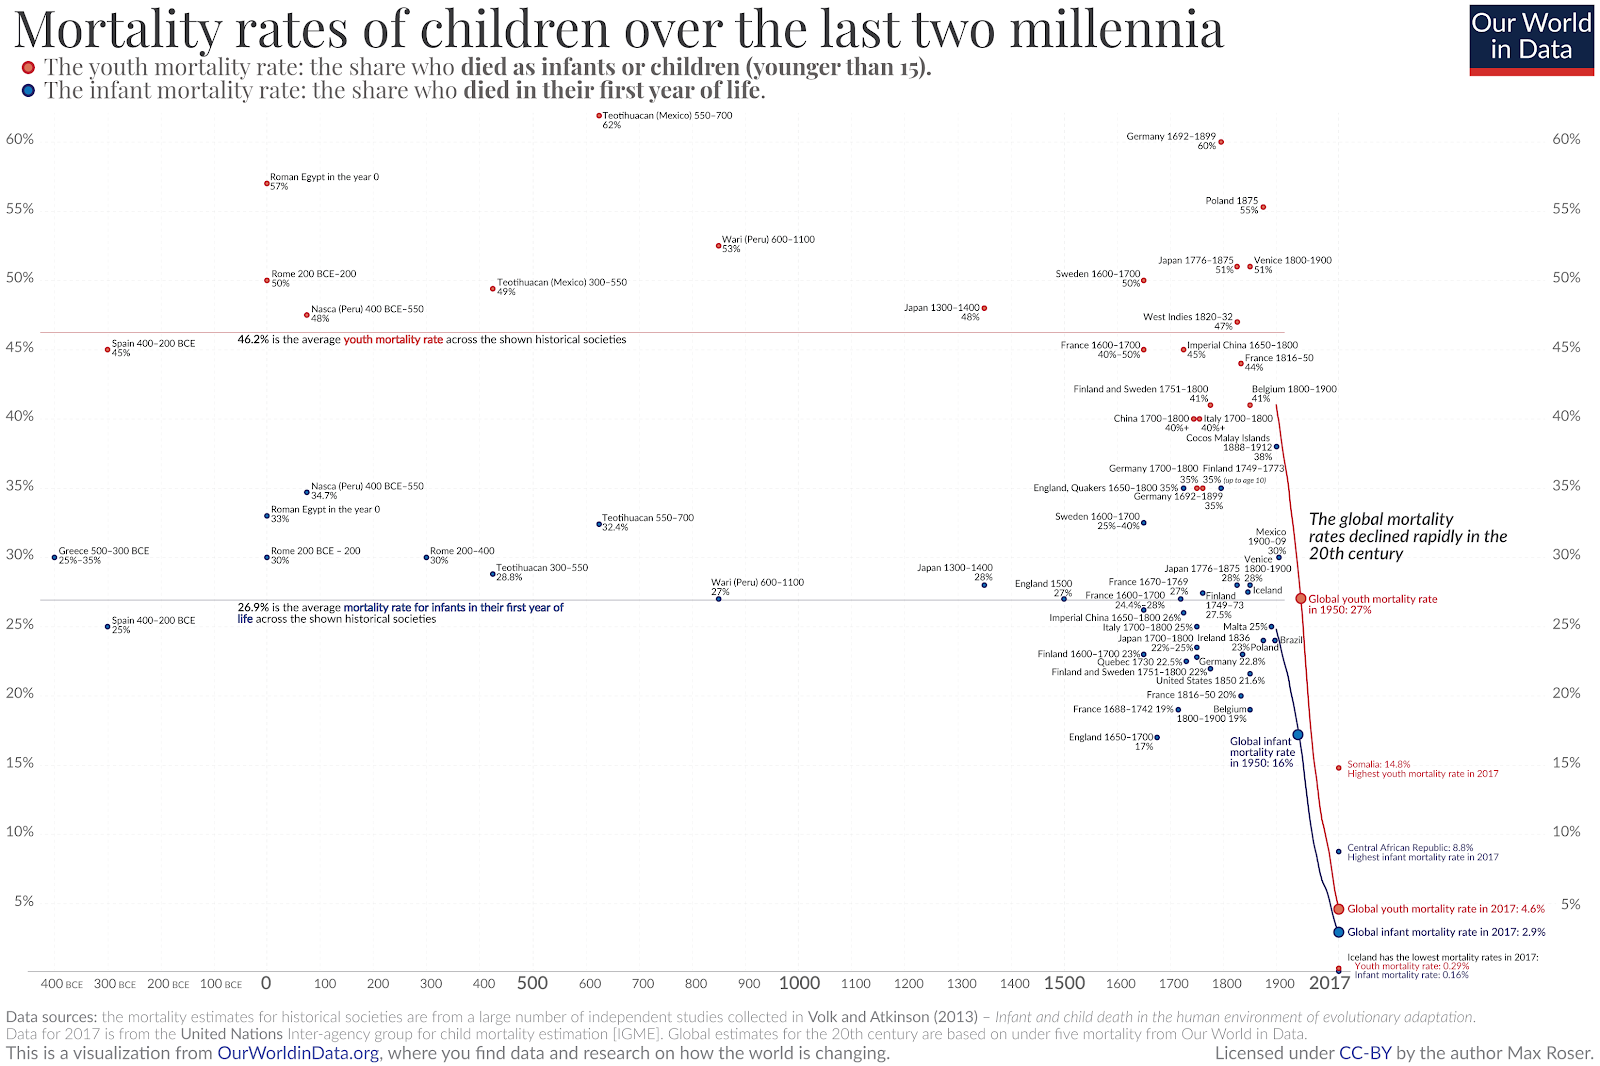
https://ourworldindata.org/uploads/2019/06/Mortality-rates-of-children-over-last-two-millennia-800x533.png
The suffering we associate with NGO’s donation appeals was common in all countries across the world 300 years ago. Before the demographic transition began, around 40% of children died before their 5th birthday. Even if they survived childbirth and their first five years many more died before they became adults. In fact, 60% died before their 15th birthday.
If we go back in time, to mid 19th century England, experiences such as those of Charles Dickens were tragically all too familiar. On 14 April 1851, Charles Dickens’s daughter Dora passed away aged just eight months old. She was his ninth child. Charles’s wife, Catherine, was herself miles away from home recovering from an illness and Charles decided to break the news to her gently. He first wrote to say Dora was gravely ill and warned her that upon reaching home she may be met with the words, “Our little baby is dead''. Catherine returned home the next day.
But then this started to change. The importance of hygiene became clearer as doctors and scholars studied the causes of disease and how it spread. They recognized the importance of keeping drinking water clean. This had a radical impact on the death rate, as fewer children died, and people died at older ages.

https://ourworldindata.org/uploads/2018/11/Demographic-Transition-Schematic-693x550.png
And so first the death rate fell, but the birth rate stayed high. Parents during this period still had large numbers of children; however, many more of them survived than previously. This second phase of the demographic transition experienced the fastest rate of demographic growth, a demographic boom known as the Early expanding phase. However concerned many of us may be about overpopulation, we must surely celebrate falling child mortality.
As the death rate falls and many more children survive childhood, parents see less need for large families. This increases the benefits of investing in children as they are more likely to survive into adulthood, the result being the cost of raising children also increases. Other factors contributing to the falling birth rate include urbanisation and economic growth. The amount of time it takes for societies to see their birth rate cut in half can vary greatly. In some places it can take two to three generations, and in others only 10 years. Regardless, as the death rate also continues to fall, the birth rate now also starts to fall. As a result, the population continues to grow, but now more slowly. This third phase of the demographic transition is known as the Late expanding phase.
Finally, the birth rate falls to such lows that it catches up with the death rate, and the population stabilizes into the fourth phase, the Low Stationary phase. What we can see, however, in the 1st Wave countries is that the demographic stages do not stop there. The birth rate continues to fall, even as the death rate stabilizes. The result is that, apart from immigration, populations start to decline. This is phase 5. These population declines in 1st Wave countries represent a radical change for societies that for the previous 200 years had experienced rapid growth.
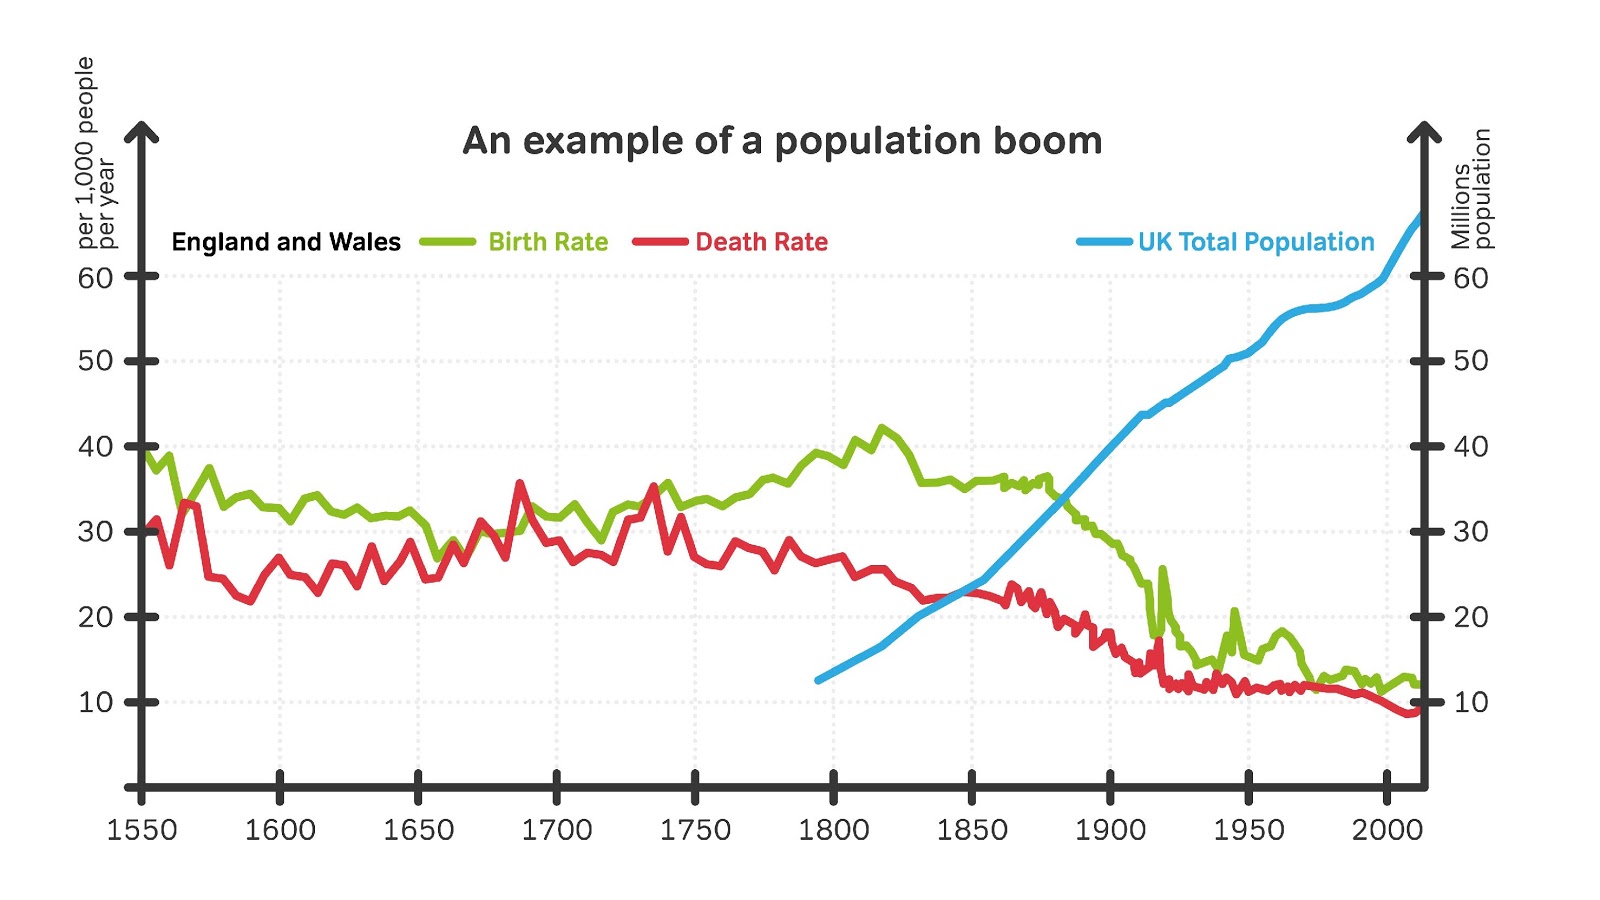
These demographic changes, as so eloquently demonstrated by statistician Hans Rosling, take place irrespective of culture or religion. The transition simply begins in different places at different times, depending on which wave a country is in. We saw it happen first in the 1st Wave countries, such as the United Kingdom. In England & Wales, the transition began in the late 18th century, and reached the 5th phase at the end of the 20th; in other words, it took over 200 years to complete. At the beginning of its transition, most mothers would have six children and during its demographic boom, its population tripled. A hundred years later, this had fallen to three. Now it is 1.8, well below the replacement rate of 2.1.
Did all countries experience a population boom?
We know that today different countries are in different stages of their demographic transition. The stage at which a country finds itself today is a good indicator of which stage in the Great Transition – to an Urban-Industrialized society – it finds itself. We need to understand how the world is divided into these four groups of countries in order to understand how the world will continue to develop through to 2100 and beyond. We can see today how 1st Wave countries are entering the fifth stage of the demographic transition, while the 2nd, 3rd, and 4th Wave countries are in the fourth, third, and second stage of this transition.
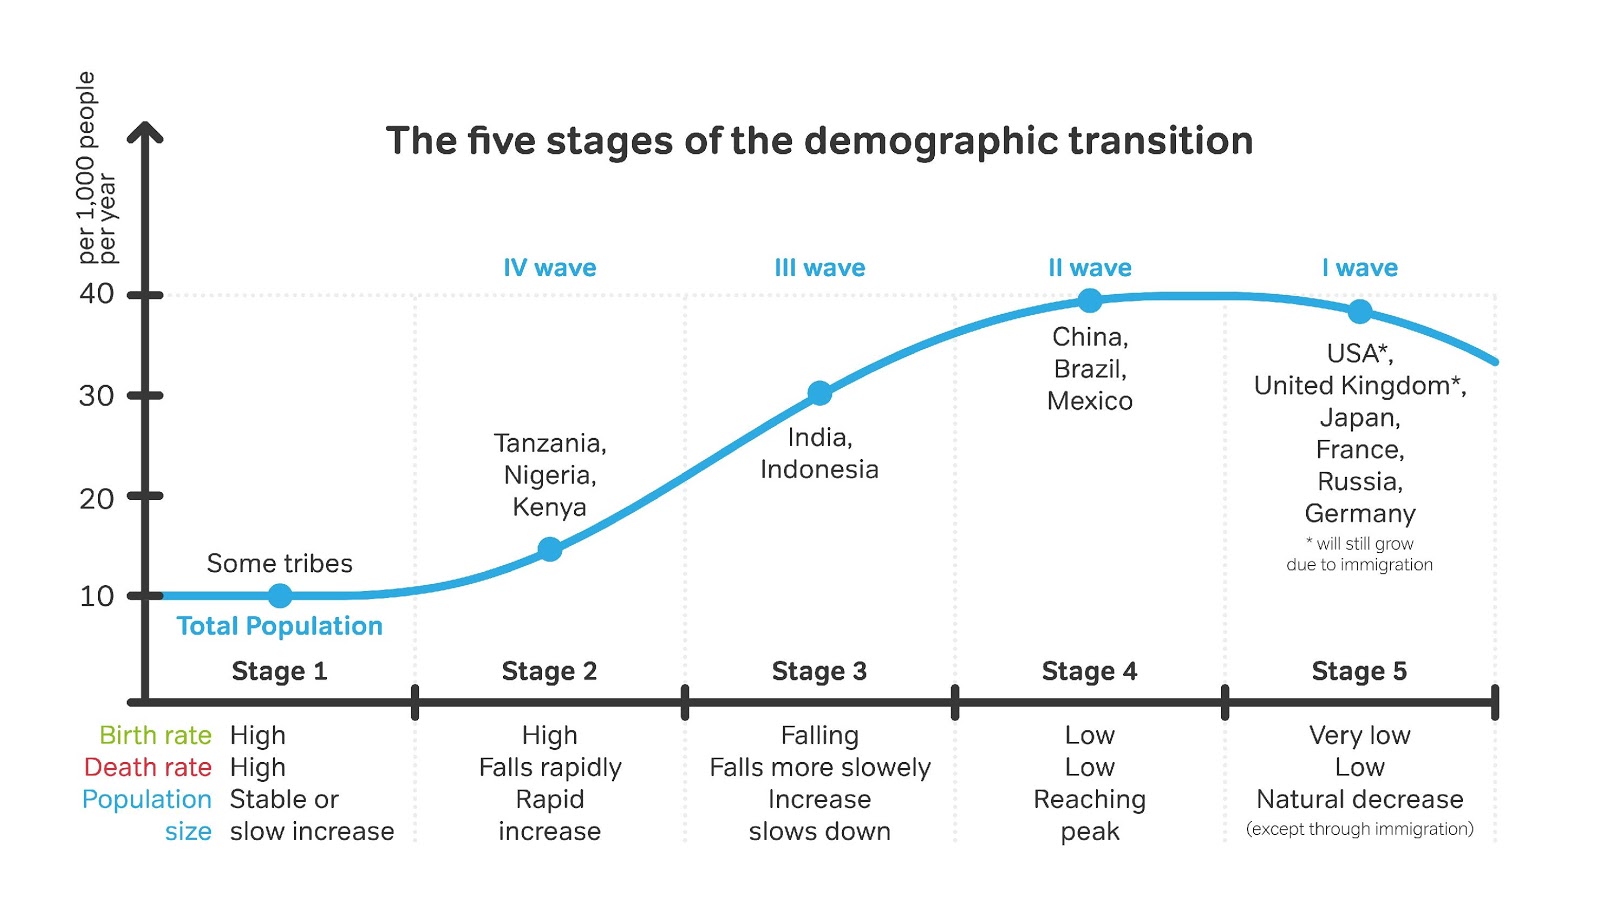
As mentioned before, different countries take different amounts of time to complete each stage in the transition. The 1st Wave countries began in the late 18th and early 19th century and took 200 years to pass from the 1st stage to the 5th stage. The 2nd Wave countries began their demographic transition only in the mid-20th century, but many will soon reach their peak, and then will start to decline. The 3rd Wave countries began this transition in the second half of the 20th century but more slowly than the 2nd Wave, and will reach their peak only after 2050. Meanwhile, the 4th Wave countries are starting their demographic transition only now, and will not reach their peak this century. Therefore, the bulk of the world’s population growth is set to come from the 3rd and 4th Waves.
Population and Fertility rate (FR)
So what happens next?
This leaves us with an interesting paradox. Cities and infrastructure built in 1st and even 2nd Wave countries will start to fall into disuse. Meanwhile, major new investments of resources and energy will need to be placed in the 3rd and 4th Wave countries to build entirely new cities and infrastructure.
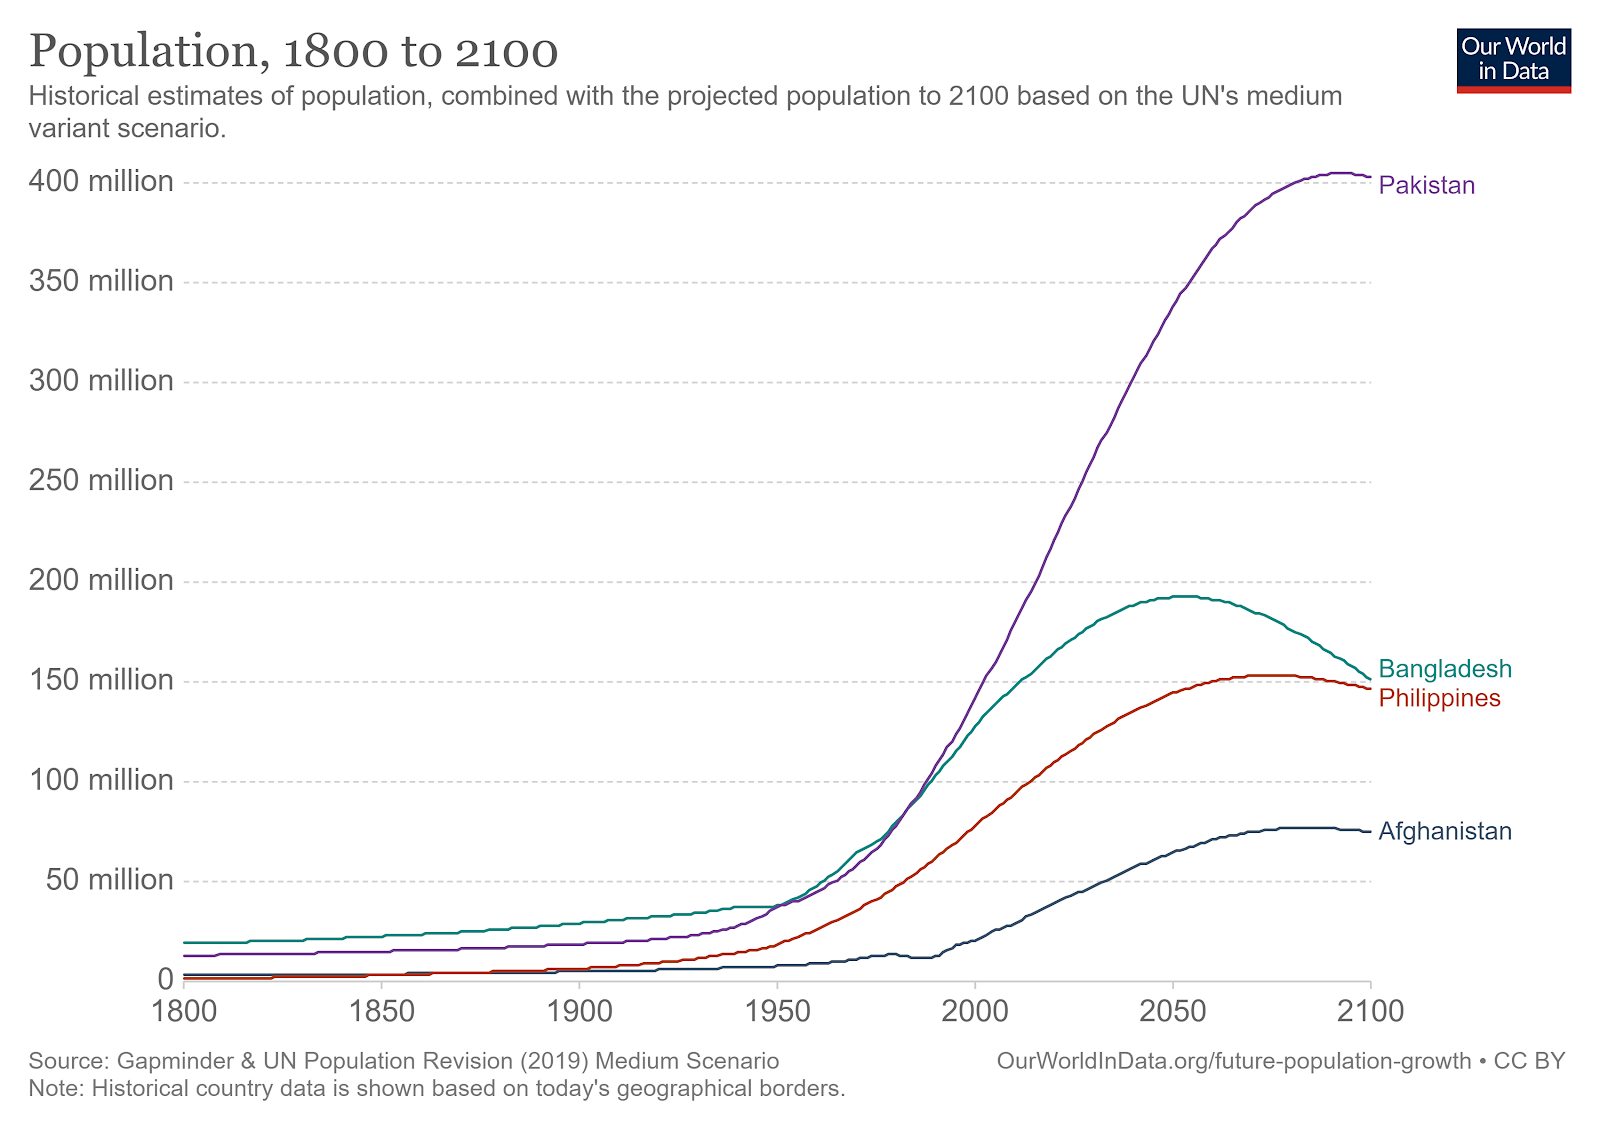
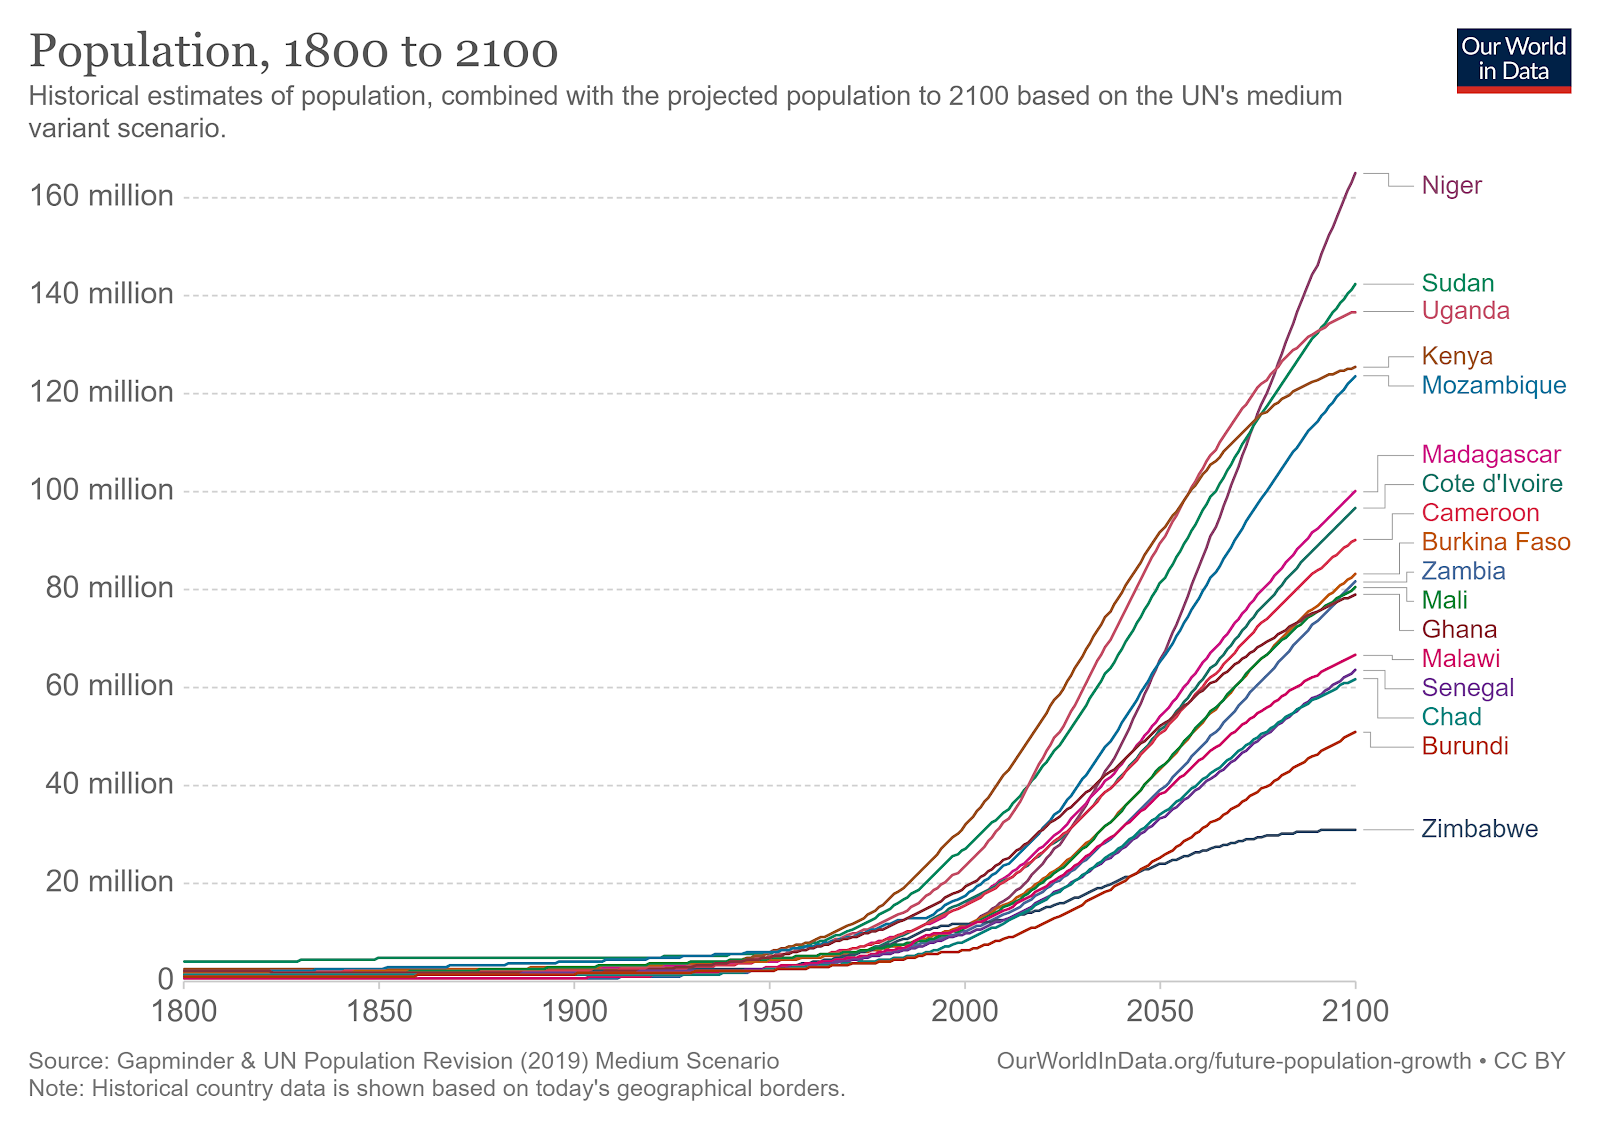
When we recognize that the world has not completed its demographic transition, we start to understand why the world’s population is set to grow the same amount in the 21st century as in the 20th century. It grew by 4.4 billion in the 20th century, and is projected to grow another 4.5 billion in the 21st century. We start to understand how future growth will come from 3rd Wave countries in Asia such as India and Pakistan, and particularly from 4th Wave countries in sub-Saharan Africa. We can predict with reasonable accuracy that the populations of 4th Wave countries are set to triple. We can project that the only 1st Wave countries that will continue to maintain their population or slightly grow will do so purely due to immigration.
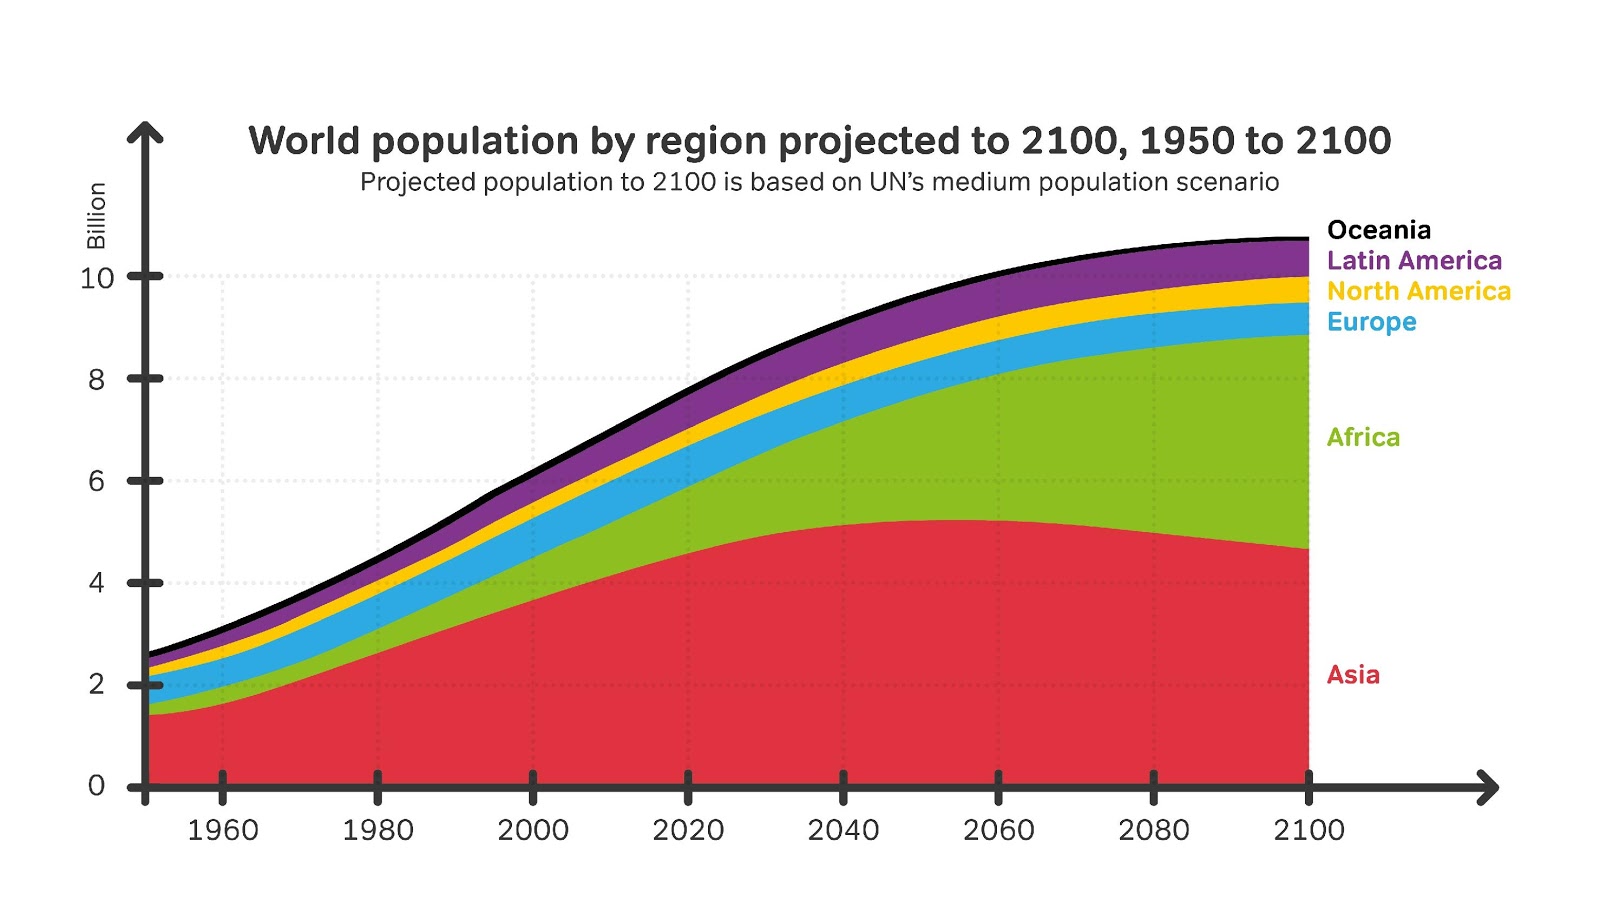
In 2100, we can expect the world’s population to be proportionally distributed very differently to today, as we can see here on the “Would population by region projected to 2100” diagram.
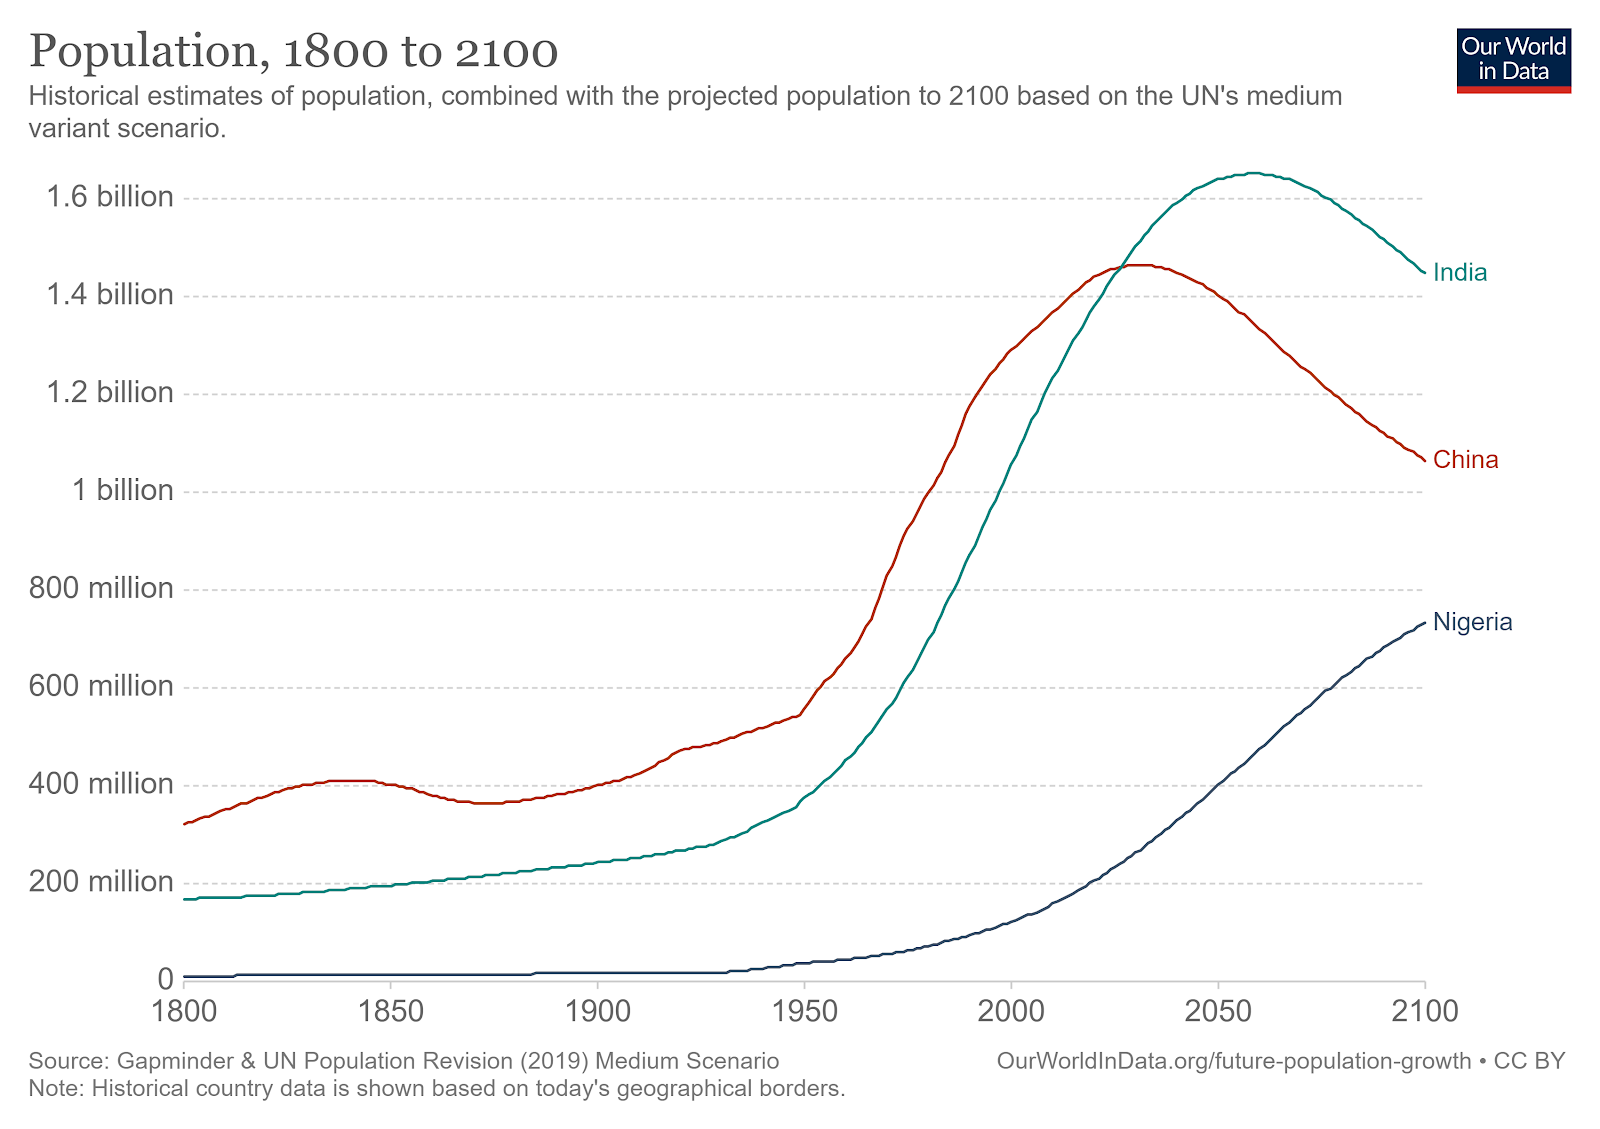
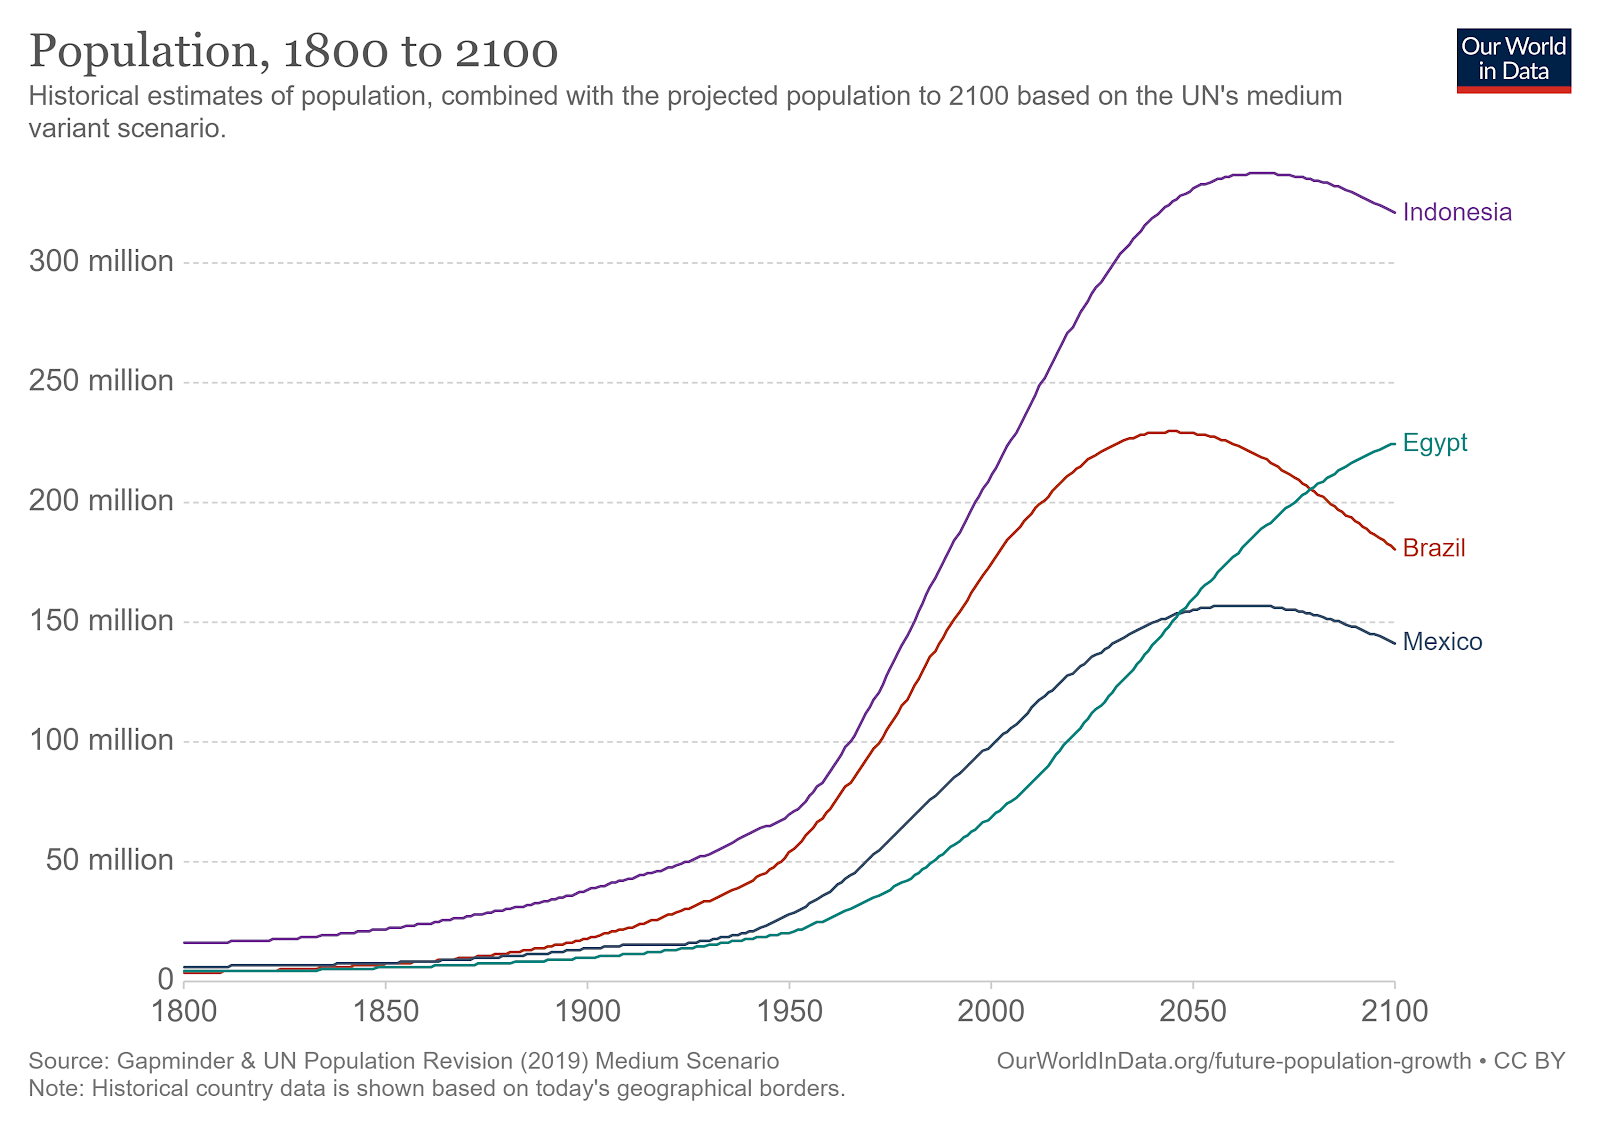
We frequently talk about China’s huge population, but in 2100 there are many that project its population will fall from 1.4 today to 1 billion. Some projections even see China’s population fall to almost 700 million - half its current size, leaving it as only the third most populous country. China will reach its peak population in the next 10 to 15 years. India will reach its peak of 1.7B in the next 40 years. Meanwhile, Nigeria which had a population of 45 million in 1960, now has a population of over 200 million and is projected to reach 800 million by 2100. The Democratic Republic of Congo had a population of 15 million in 1960 and despite an ongoing conflict, it has reached over 80 million today, and is expected to have 246 million in 2100. Tanzania has grown from 10 million in 1960 to 54 million today, and is set to grow to 186 million in 2100.
So is population growth the cause of global problems?
For those concerned that the world is already overpopulated, these projections that the population is set to grow far larger still is a significant cause for concern. In fact, concerns about the world population have been voiced at least since Malthus in the late 18th century. The world’s two largest countries by population, China and India, both made significant political efforts to speed up the decrease in birth rates. China’s one-child policy is now infamous. In the space of a decade, China moved from 6-7 births per woman to 2.5, and then a further decade to get to 1.5. Less well known is India’s history – in 1976, the Indian government had a policy of mass sterilisation. Using emergency measures, set in place by Indira Gandhi in the previous year. In 1976 alone, the Indian government sterilised 6.2 million men. Entire villages would be surrounded and men rounded up. The next year, Indira Gandhi's party was voted out, and the new government’s focus shifted to birth control. India took around 50 years to see its births per woman fall from 6 to 3. Death rates are still falling in India, leaving it, along with many other Asian countries, in the Late Expansionary phase.
Things have changed. Such morally questionable and politically unpopular policies have been replaced with policies focused on economic development, education, female sexual education, infant vaccinations, and contraception. These policies are central to the debate surrounding population growth and development policies. Many criticize NGOs fighting child mortality in the developing world, arguing that they are in fact creating problems by increasing the population. Others, however, argue that decreasing infant and child mortality means that they are encouraging smaller families, accelerating the decline of the birth rate.
Regardless, population growth may be a problem, but it is not the main problem. We could support 11 billion people living in the agrarian era, but it only took 1 billion living in the urban industrial era to start damaging the climate and much more. Sub-Saharan Africa’s population already grew eight times larger in the last century, and yet, it had little to no impact on global energy consumption, for example. This is only the case because most of Sub-Saharan Africa is only just leaving the Agrarian era. We will see this in far more detail in the coming videos. The key learning from the world’s changing demography is that efforts to address major global environmental and resource challenges need to account for the fact that today, 3 billion people already born and living in 3rd and 4th Wave countries require new cities and infrastructure to be built, consuming more energy and resources. In fact, more needs to be built in many of the 2nd Wave countries who have yet to close the gap.
Of course, there are still those who believe that it would help to have one or two billion fewer people, requiring new apartments in cities, more cars and air conditioners. But it is the opinion of the author of this course that 1 or 2 billion fewer people pales in comparison to the tripling (or more) of demand for energy, food, water, and other resources in the 21st century, driven by the world’s existing population moving from an agrarian to an urban industrialized society.
Countries at different stages of the demographic transition will face radically different challenges. From the first wave countries’ perspective, now in a low stationary period of stable population due to low births matched by low deaths, the concern is very different. Many are moving into a new fifth phase of declining populations. The challenges they face include, for example, how to support an ageing population with an ever declining workforce or whether further economic growth is possible. Those countries in the Third and Fourth Waves will phase radically different challenges from those of the First Wave and are likely to push their own very different agendas on the international stage. The Third and Fourth Wave need rapidly expanding economies to produce improving living standards for their young populations.

After two hundred years of domination, the countries of the First Wave may be uncomfortable with this shift, yet whatever their thoughts, the transition is inevitable. Efforts by countries in all phases would be better spent on trying to understand each other’s radically different challenges. Only that way will meaningful global solutions to global challenges be identified.
Conclusion
The world is going through the final stages of a great transition that began over 200 years ago. The transition is not yet complete and will leave the world looking very different from how it looks today. For those looking for solutions to global challenges, we should recognise the challenge not of a 30% increase in the world population, but that face that billions of people already born aspire to an urban industrialised life.
The topics covered in this course are interconnected, from energy… to food… and urbanization… to climate change. In this long-read, we have shown how and why we can expect the world’s population to continue to grow. Namely, that all countries go through predictable stages of a demographic transition regardless of religion or culture. We have also covered where we can expect this growth to take place. What the following videos will make clear is that we will already struggle to help the world’s existing population fully transition to an urban industrialised society. The solution to the world’s problems cannot be found by preventing further growth in the world’s population.